BrainBrowser is a set of web-based 3D visualization tools primarily used for viewing neurological data, such as MRI scans. It allows for real-time manipulation and analysis of 3D neuroimaging data through any modern web browser. BrainBrowser dynamically loads only those parts of the dataset currently being viewed by the user.
Visit BrainBrowser Website
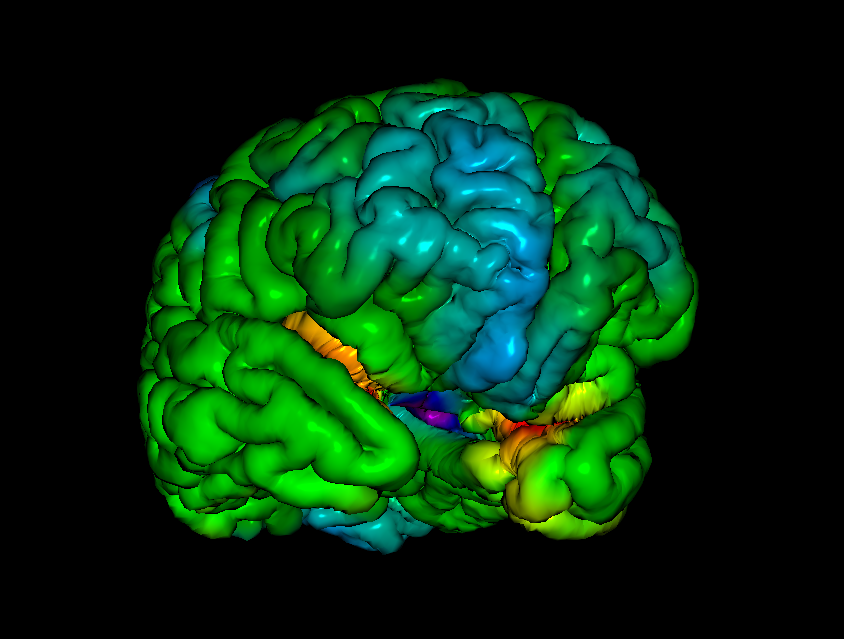
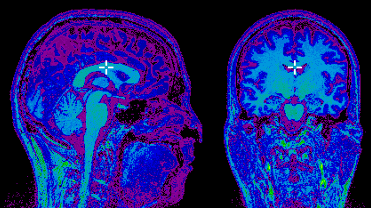
Surface & Volume Viewer BrainBrowser has two main components, the Surface Viewer and the Volume Viewer. The Surface Viewer is a 3D viewer which can display 3D surfaces in real-time and map various types of data to them. It is possible to overlay color data representing different information about the surface (e.g. cortical thickness, correlations, etc.). Intuitive mouse and touch controls can be used to rotate, pan and zoom. The BrainBrowser Volume Viewer allows users to navigate 3D or 4D MINC structural or functional MRI volume data. The Volume Viewer simultaneously displays slices along the sagittal, transverse and coronal planes, and the viewer can navigate along each dimension. A volume’s intensity data can be visualized in various ways by applying different colour maps. When dealing with 4D functional data, the Volume Viewer can navigate along the time dimension as well. Technical Features BrainBrowser is an open source JavaScript library. The Surface Viewer is a WebGL based viewer and the Volume Viewer is a HTML5 canvas-based viewer. Since BrainBrowser uses these open source web-standard technologies, only a recent web browser is required to use it. No local installation of software or plugins is required. Additional Features Collaboration & Sharing of Data BrainBrowser’s integration into the standardized web platform also allows users to use 3D data visualization in novel ways, such as for data distribution and sharing. Publication Tarek Sherif et al (2014) BrainBrowser: distributed, web-based neurological data visualization, Front Neuroinform. 2014; 8:89 doi:10.3389/fninf.2014.00089 [Full Ref]Surface and Volume Viewer
Technical Features
Additional Features
Collaboration and Sharing of Data
Publication